
🚨Newsflash!🚨 The climate and subsurface interact
News about things that should come as no surprise to anyone

For the last five years I have worked at Njord Centre. Njord Centre is a research center at the University of Oslo that sprung out of a previous research center called the Physics of Geological Processes but colloquially known as PGP (not the encryption program, haha). The core idea behind PGP was that if you put geologists and physicists in the same room together, this would probably develop a lot of new research ideas that would not have happened individually. And it generally worked, Njord Centre has been awarded more than 400 million NOK (approximately 40 million US dollars) in national and international grants in the period of 2018-2025 (according to the Njord Annual reports and internal documents). Njord Centre publishes around 60-70 papers a year across a variety of topics including multiphasic fluid flows, environmental studies on earthquakes and glaciology and carbon sequestration, biophysics and material science, and friction and fracturing. Njord hosts conferences like the FricFrac Meeting and the Exploring System Dynamics with AI meeting. Njord also actively collaborates with artists and some of their art has been shown in magazines like Physics Today.

For the last year and half at Utrecht University and Njord I have worked on a Research Council of Norway (Forskningsrådet) funded project that I named “SerpRateAI”. This project is just a drop in the overall Njord budget (only 4.2 million NOK out of 400 million NOK!) and it’s goal is to build a systems level understanding of the subsurface processes that can be used to understand how carbon can be stored underground. A core part of this project was working with people at Utrecht University in The Netherlands and Woods Hole Oceanographic Institution in the USA to better understand some of the geological processes that are captured in the data. I have always felt like this project took the ethos I gained from working next to Njord and inside of Njord of interdisciplinary science and computing and applied it to the data from the Oman Drilling Project. I have discussed this project before here:

where I talk about how I tried to identify everything in a 9 month long hydrophone data set without ever trying to identify a direction. Haha, who would have thought that wouldn’t work! But I wanted to give an overall introduction to the idea of the project, some of it’s conclusions, and a hint at where I am going to take it next.
To give you a short introduction, it is quite likely that we can store carbon inside of certain kinds of rocks called peridotites. This is because when they are exposed to carbon bearing fluids (think coca cola🥤🥤🥤), the rocks will absorb the carbon from the fluids and turn into different kinds of rocks. This means that the carbon can stay in the rocks forever and never again plague humanity from the atmosphere. This process is called serpentinization and is also where the project name “SerpRateAI” came from. When these rocks absorb carbon and change they grow larger. What happens when something grows larger in a confined space and has no where to go? It probably starts breaking things everywhere. And this is the hope actually, that if there is enough fluids the rocks will continuously absorb carbon, grow in volume, and break and move the fluids around underground. But nobody has ever observed that in the wild before. I hope that I am able to build an AI-enabled model that can help capture and quantify these changes.
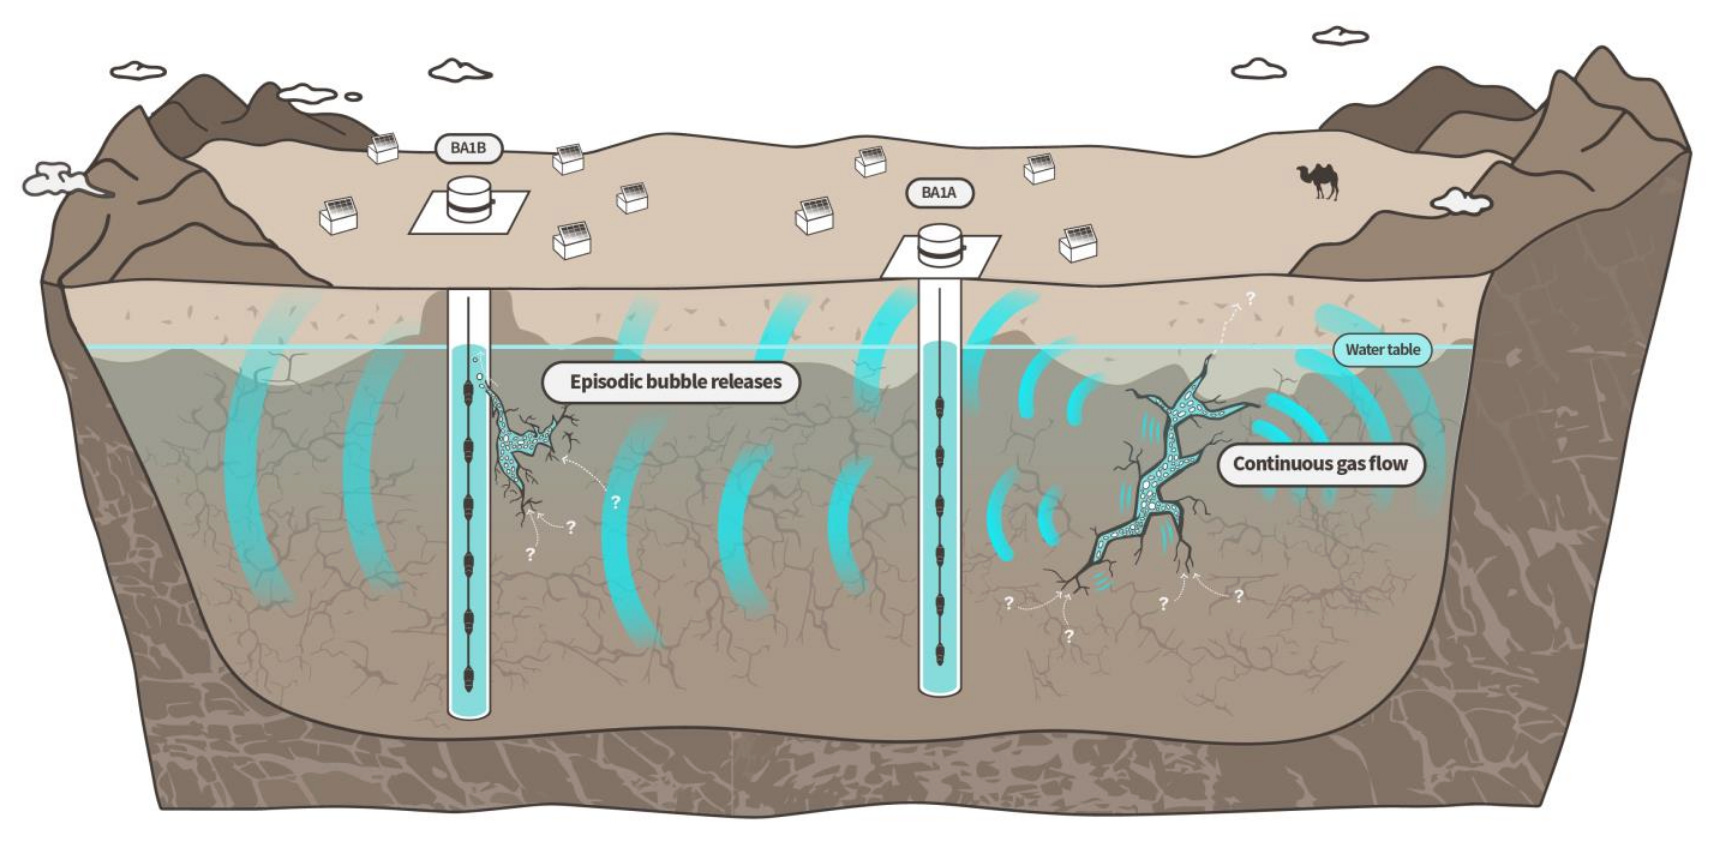
To that end the Oman Drilling Project placed a number of sensors deployed inside of rocks in Oman that can be used to study this kind of phenomena. Part of this work includes sensors deployed inside of boreholes (see above) but not all sensors are there. These sensors measure acoustic energy, water levels, temperature changes, and also we have climate data like precipitation, and soil moisture. These cover a 9 month period. You can see a diagram of this above. Other kinds of data include x-rays and photographs of rocks taken from the boreholes, physical measurements like rock resistivity, and even written comments by geologists about their observations.
The first thing to see is that we can observe gas moving from inside the walls of the borehole into the borehole fluids. This is from this paper I wrote a couple years ago:
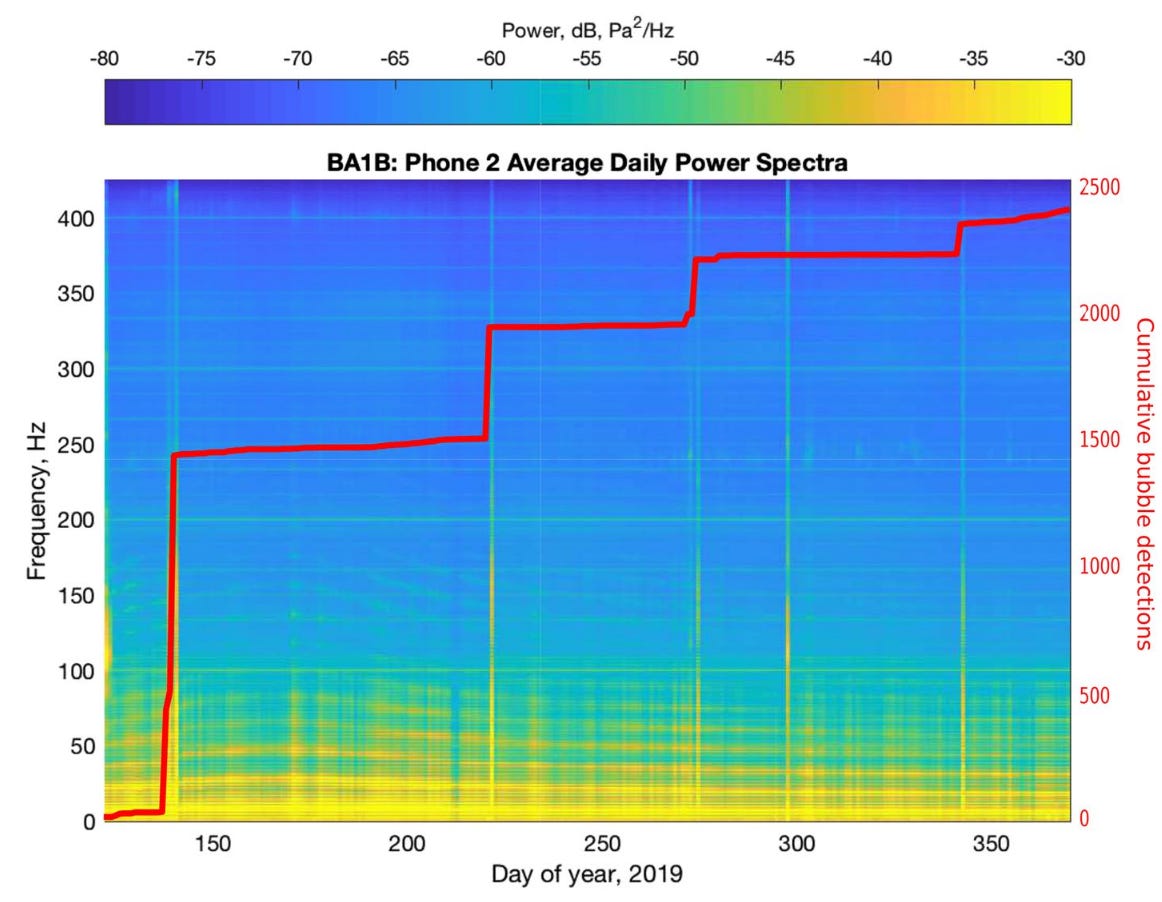
The main take away from this plot is that there are bubbles that come out of the rocks at intermediate intervals (that’s the red line, the blue and yellow tell you about how much acoustic energy is coming out at different frequencies at different times). You can find the paper here if you want to know more about bubbles. These bubbles could be all sorts of gas, some people think its hydrogen but other people don’t. If it is hydrogen it would be great evidence that this reaction driven fracturing process is ongoing in the subsurface because hydrogen is one of the products of the serpentinization process I mentioned before. But we don’t have any measurements on the type of gas (can’t count protons using acoustic energy) so different people have different opinions about what the gas actually is. Disagreements are common in science and building consensus from data and discussion is part of the fun of science in my opinion.
The second thing to see is that we see is fracturing ongoing in the borehole several years after the borehole was drilled/cored. That is, we hear the rocks breaking. It is common that soon after a borehole is created it might settle a little. The stresses of all the surrounding rocks need to reorient around the new hole that is inside of them. But these should all reorient rather quickly and so years later the borehole geometry should be more or less static without some kind of external forcing (like a seismic fault nearby moving). So observing fractures means that something interesting is probably going on in the borehole and that is exactly what you see in the plot below.
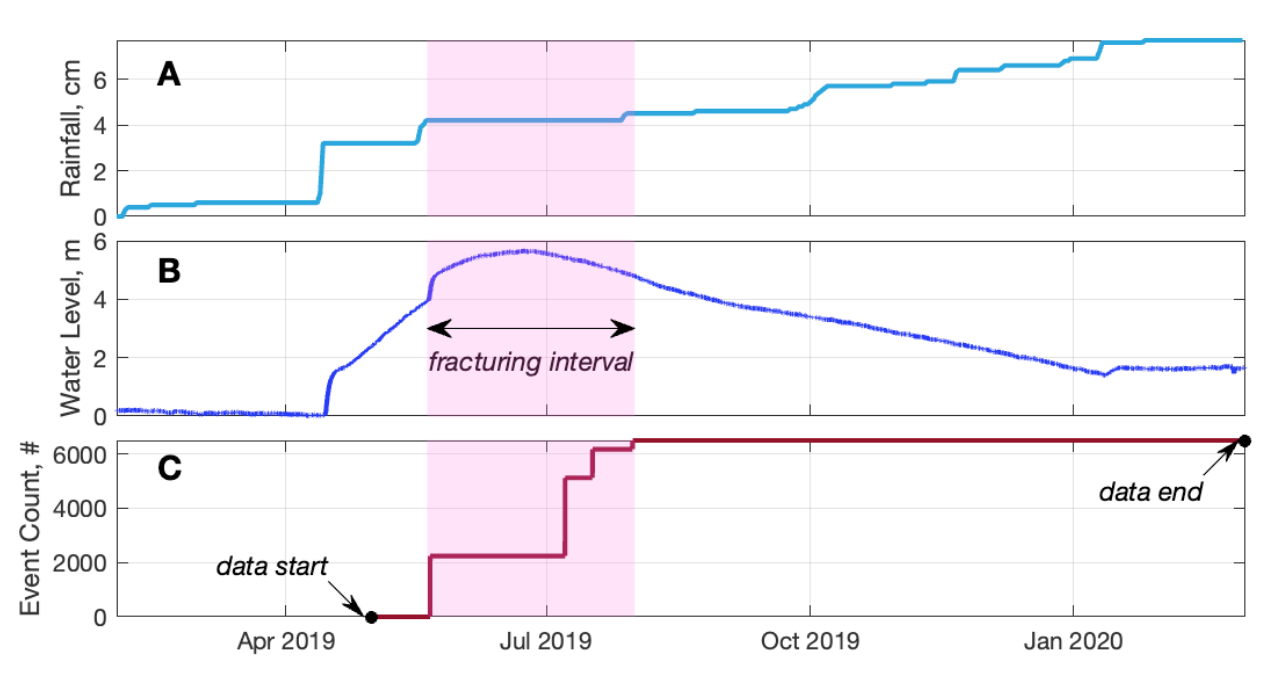
The first thing to note is that these fractures (bottom plot, red line) occur during the same time period as the bubbles in the plot above. The second thing to note is that we noticed (middle plot, dark blue line) that right before the fractures started, the water levels in the borehole increased a lot. Why did the water levels in the borehole increase a lot? Well, (top plot, light blue line) it rained! What we see is that actually there was raining during these time periods and there is then fracturing that occurs underground. This is because the pore pressure increases (the water level) and this is one of the primary causes of underground fracturing. If you want to read more about this effort you can find this paper here. We also suggest that there could be some stress due to the volumetric expansion of the rock because the rock was changing/growing because of fluids. Perhaps there is, perhaps there isn’t. Everything is correlated.
After doing all this kind of “Earth system analysis” I wanted to take a detour because the Oman Drilling Project produced a lot of other data. Fracture networks are obviously important to understanding this serpentinization process since the fracture network is the byproduct of these fluids moving around underground. So I thought that maybe there is some kind of “optimum” level of fracture network complexity that would be predictive of where active rock changing was occurring. That is, if there is a very dense fracture network, then the rocks had already changed, and if there was a very little fracture network than the fluids wouldn’t really be able to access the rocks to change them. So there must be some middle ground where it happens. So I built this big data processing pipeline to try and untangle all this.
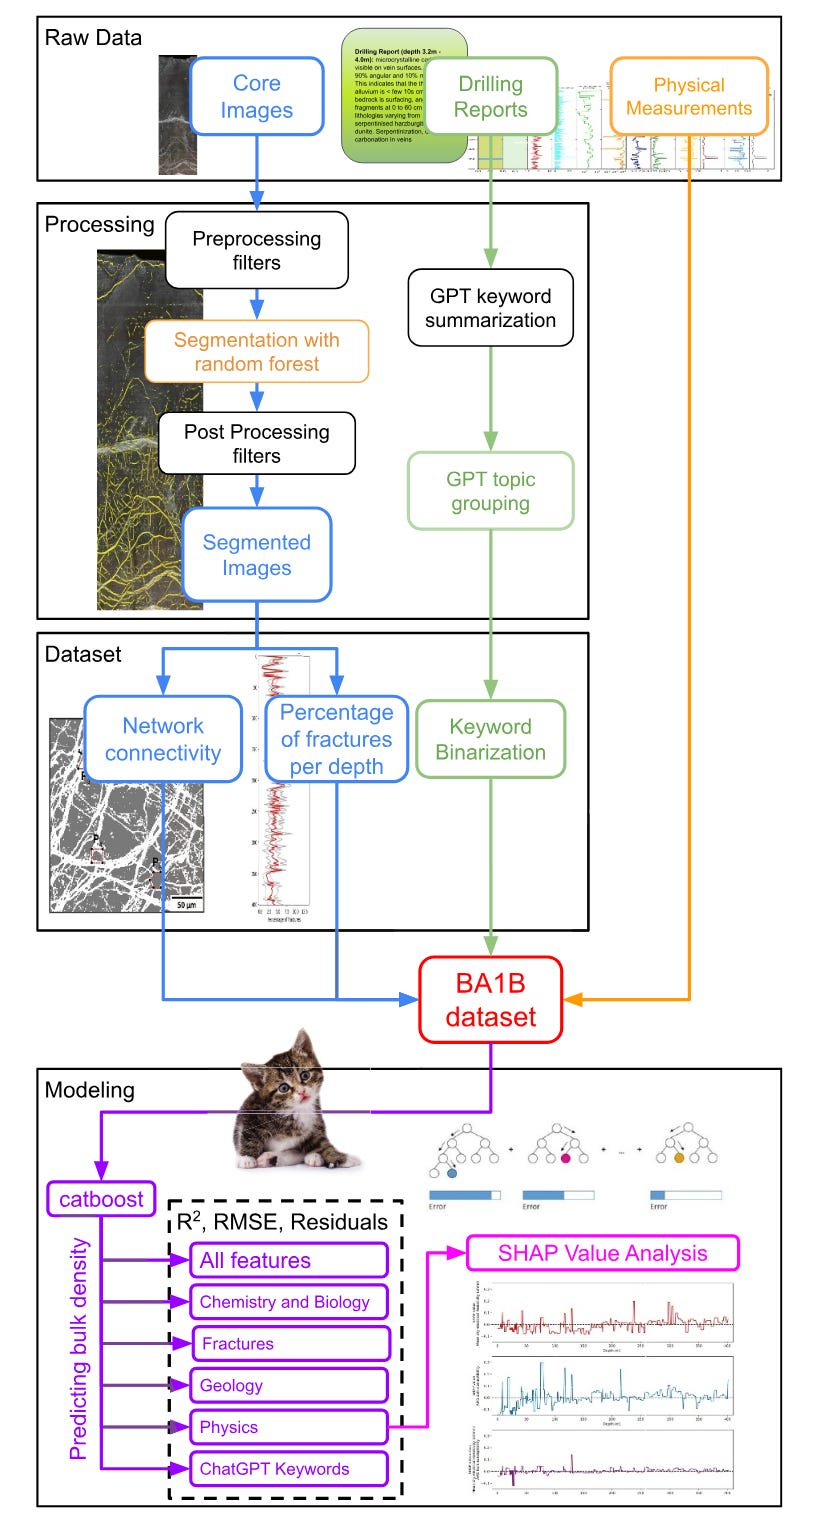
The first thing to say is that my idea didn’t really work. We didn’t see that the fracture network density was predictive of anything. In fact, it was one of the least predictive features in the whole data set! This was rather frustrating to be honest because I thought this idea was quite clever. But oh well. Clever ideas are great but science isn’t about clever ideas it’s about making models that work.
So I played around with the data and eventually came to some conclusions and this paper got published recently and you should go and read it. This paper kind of went in a different direction then I intended but that is science.
While I was working on integrating cats into my daily workflow my colleague Tianze Liu at Woods Hole Oceanographic Institution was busy analysing the acoustic data that was gathered in Oman. Tianze demonstrated that there is a subsurface coupling with the sun. That is, the sun comes up, heats up the surface, the surface expands ever so slightly due to the thermal gradient, and that causes a bit of pressure deep into the rocks. This causes the fractures where the fluids are to change their shape ever so slightly and that causes the frequency that those cracks oscillate at to change and oscillate as the sun rises and sets. This temperature induced gradient doesn’t cause the gas flux, it only alters the signal. But this is really cool. You can read this paper here.
What Tianze showed is complimentary to the papers I wrote and that brings us to the title of this post which is 🚨Newsflash!🚨 The climate and subsurface interact! Taken together, there is an implication across these papers that subsurface changes could be motivated and even controlled by the climate. And just in case you think these are just my crackpot theories, recent papers such as this one suggest that even seismicity (i.e., earthquakes) could be motivated by climate interactions.

But does it? As far as the data from Oman goes, I think what we actually have here is a lot of circumstantial evidence. And if you have watched a lot of Law and Order, you will realize that circumstantial evidence is not enough to convict. So now, we have all these systems, they seem to be coupled between the what goes on above ground and below ground and we want to really begin to articulate at least when this is happening (where would be nice too, but likely too difficult). So, that is what I am working on now. Trying to build a time-series model that couples these highly disparate and multi-modal data together in a way that can expose system level dynamics. Just looking at the plots of the fractures and the bubbles it seems like there is this kind of “episodic system coalescence”. But we shall see. Come find me and I can use more big words that sound clever while we discuss what is really going on in the Oman peridotites. So wish me luck! And seriously, feel free to reach out if you have any ideas.
This substack benefited greatly from conversations with Tianze Liu and François Renard.
